Theme
Dashboard
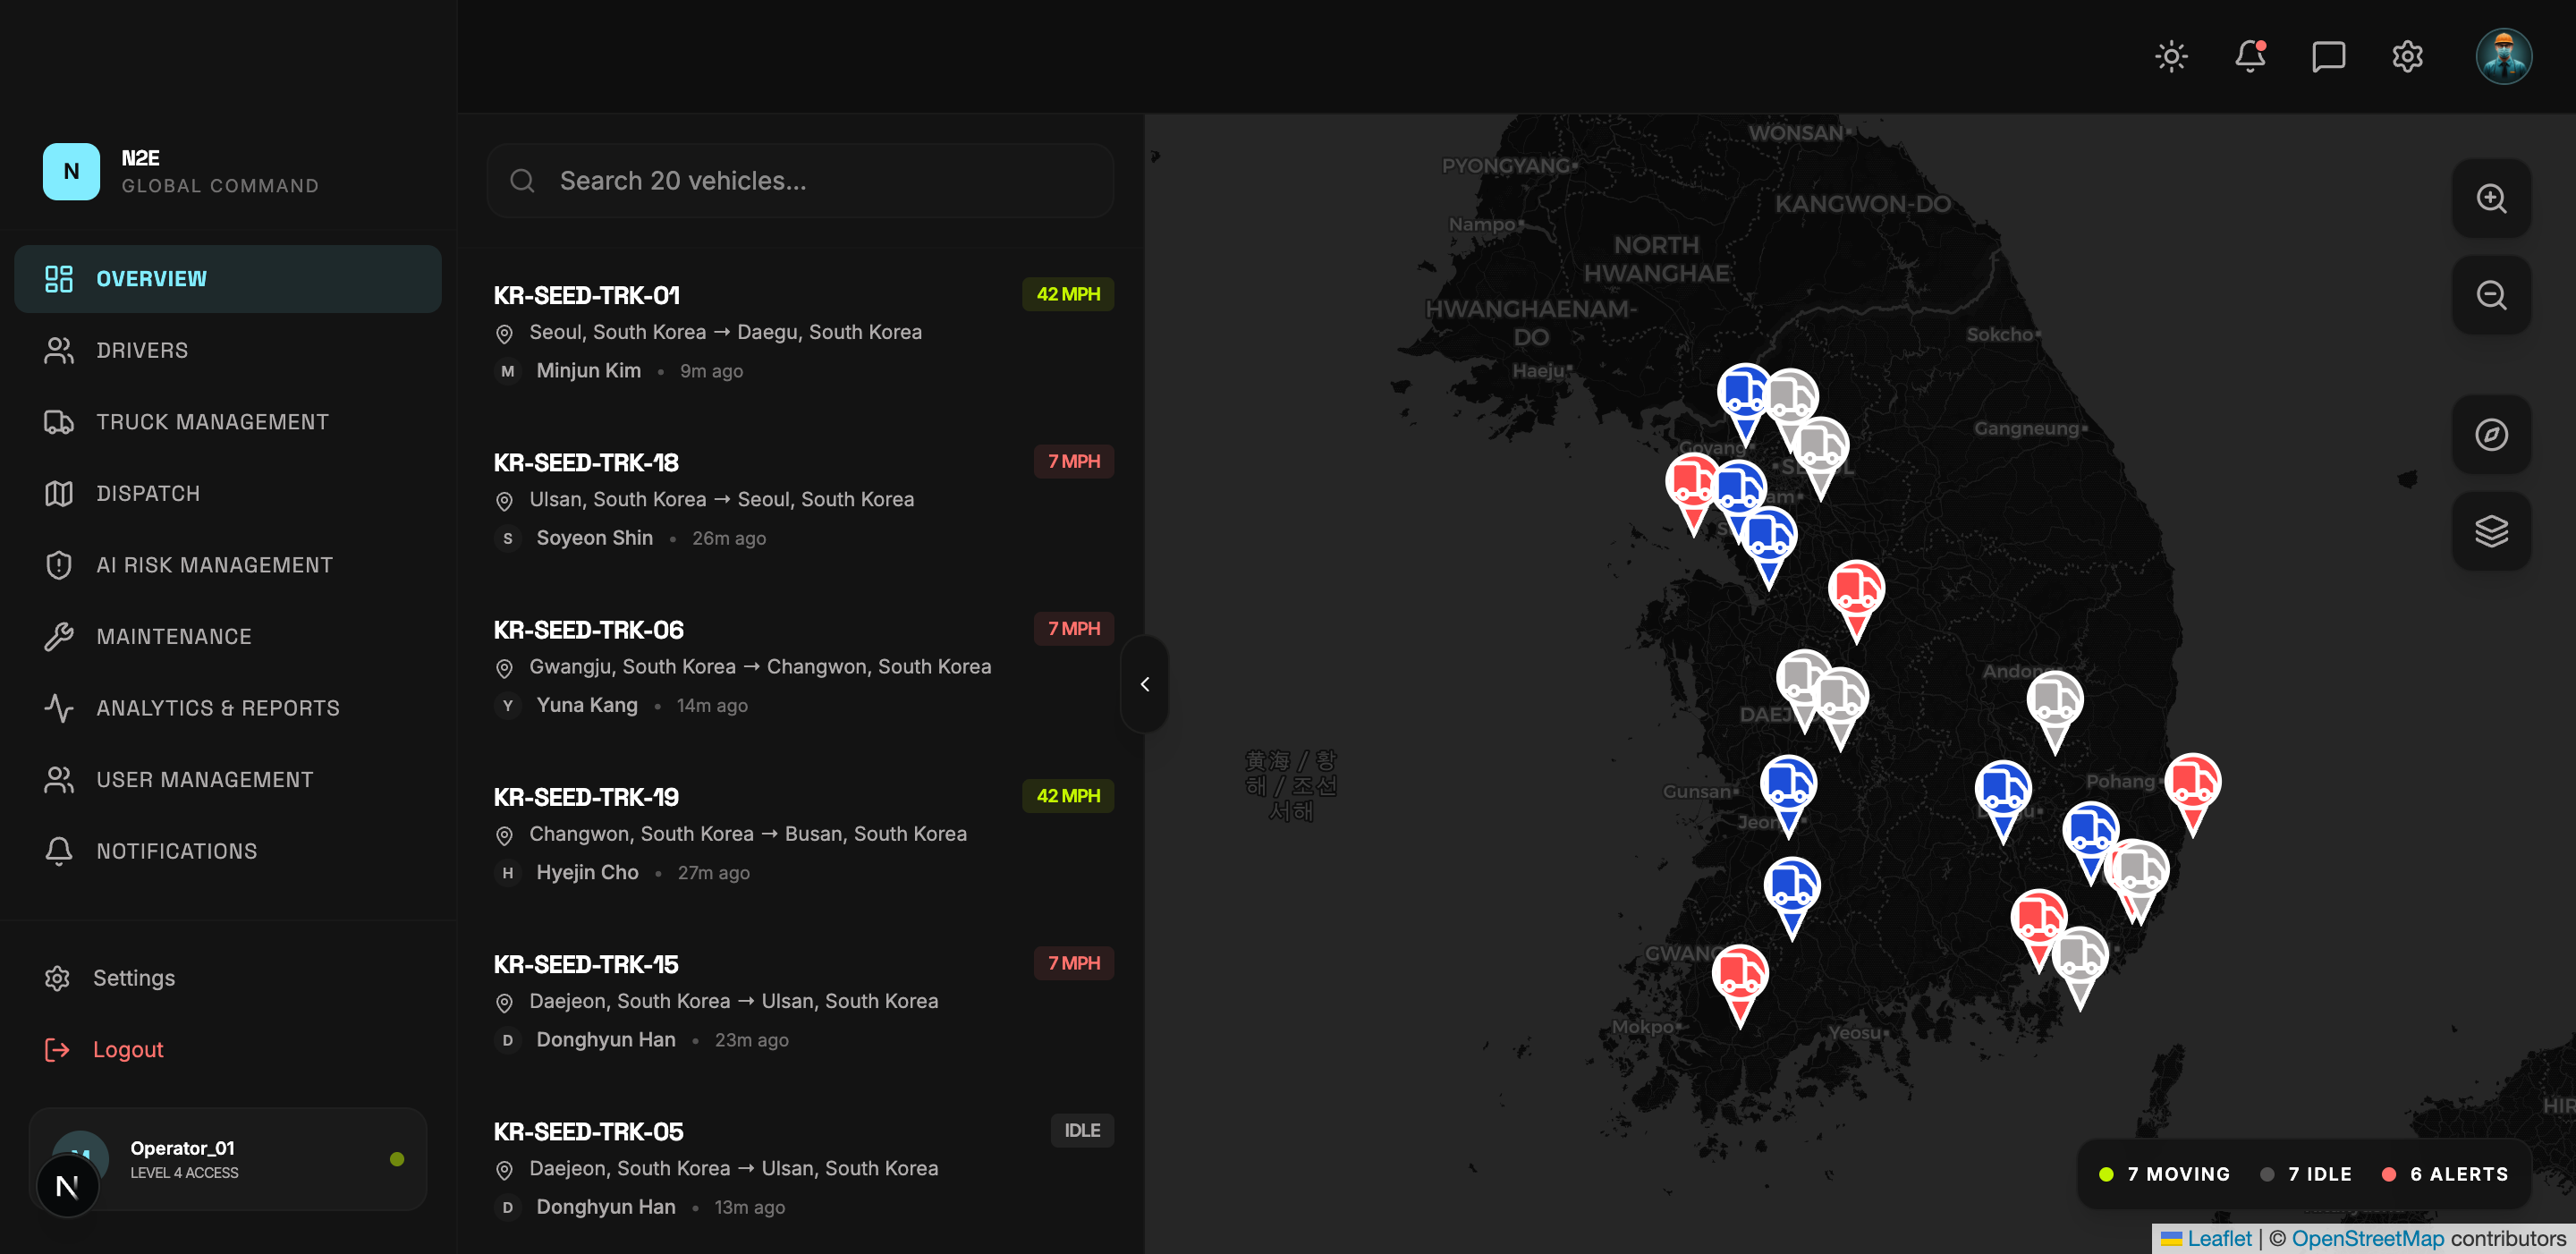
The dashboard is the global command center. It is the landing page after sign-in and is reachable from the OVERVIEW item in the sidebar or by clicking the N2E logo.
What you see
The dashboard aggregates the most important fleet-wide signals into a single view:
- Active vehicle count and operational status.
- Driver counts and verification status.
- Live alerts and recent risk events.
- Maintenance tickets requiring attention.
- Quick links into the other modules.
Stats strip
A row of summary cards across the top shows totals such as active fleets, uptime, risk alerts, and on-time rate. These pull from the same data sources as the dedicated module pages, so they always agree with the detailed views.
Navigating to a module
Click any sidebar item to drill into that module. The dashboard remains accessible by clicking the N2E logo or OVERVIEW at any time.
Empty state
A brand-new tenant with no trucks, drivers, or telemetry yet will show zeroed counters across the entire dashboard. Add data through Drivers, Truck Management and Dispatch to populate the metrics.