Theme
Analytics & Reports
The Analytics module gives you fleet-wide insights and automated report generation.
Sections
The page is organised into three tabs:
- STATS & INSIGHTS (default)
- DATA EXPORT
- GRAPH
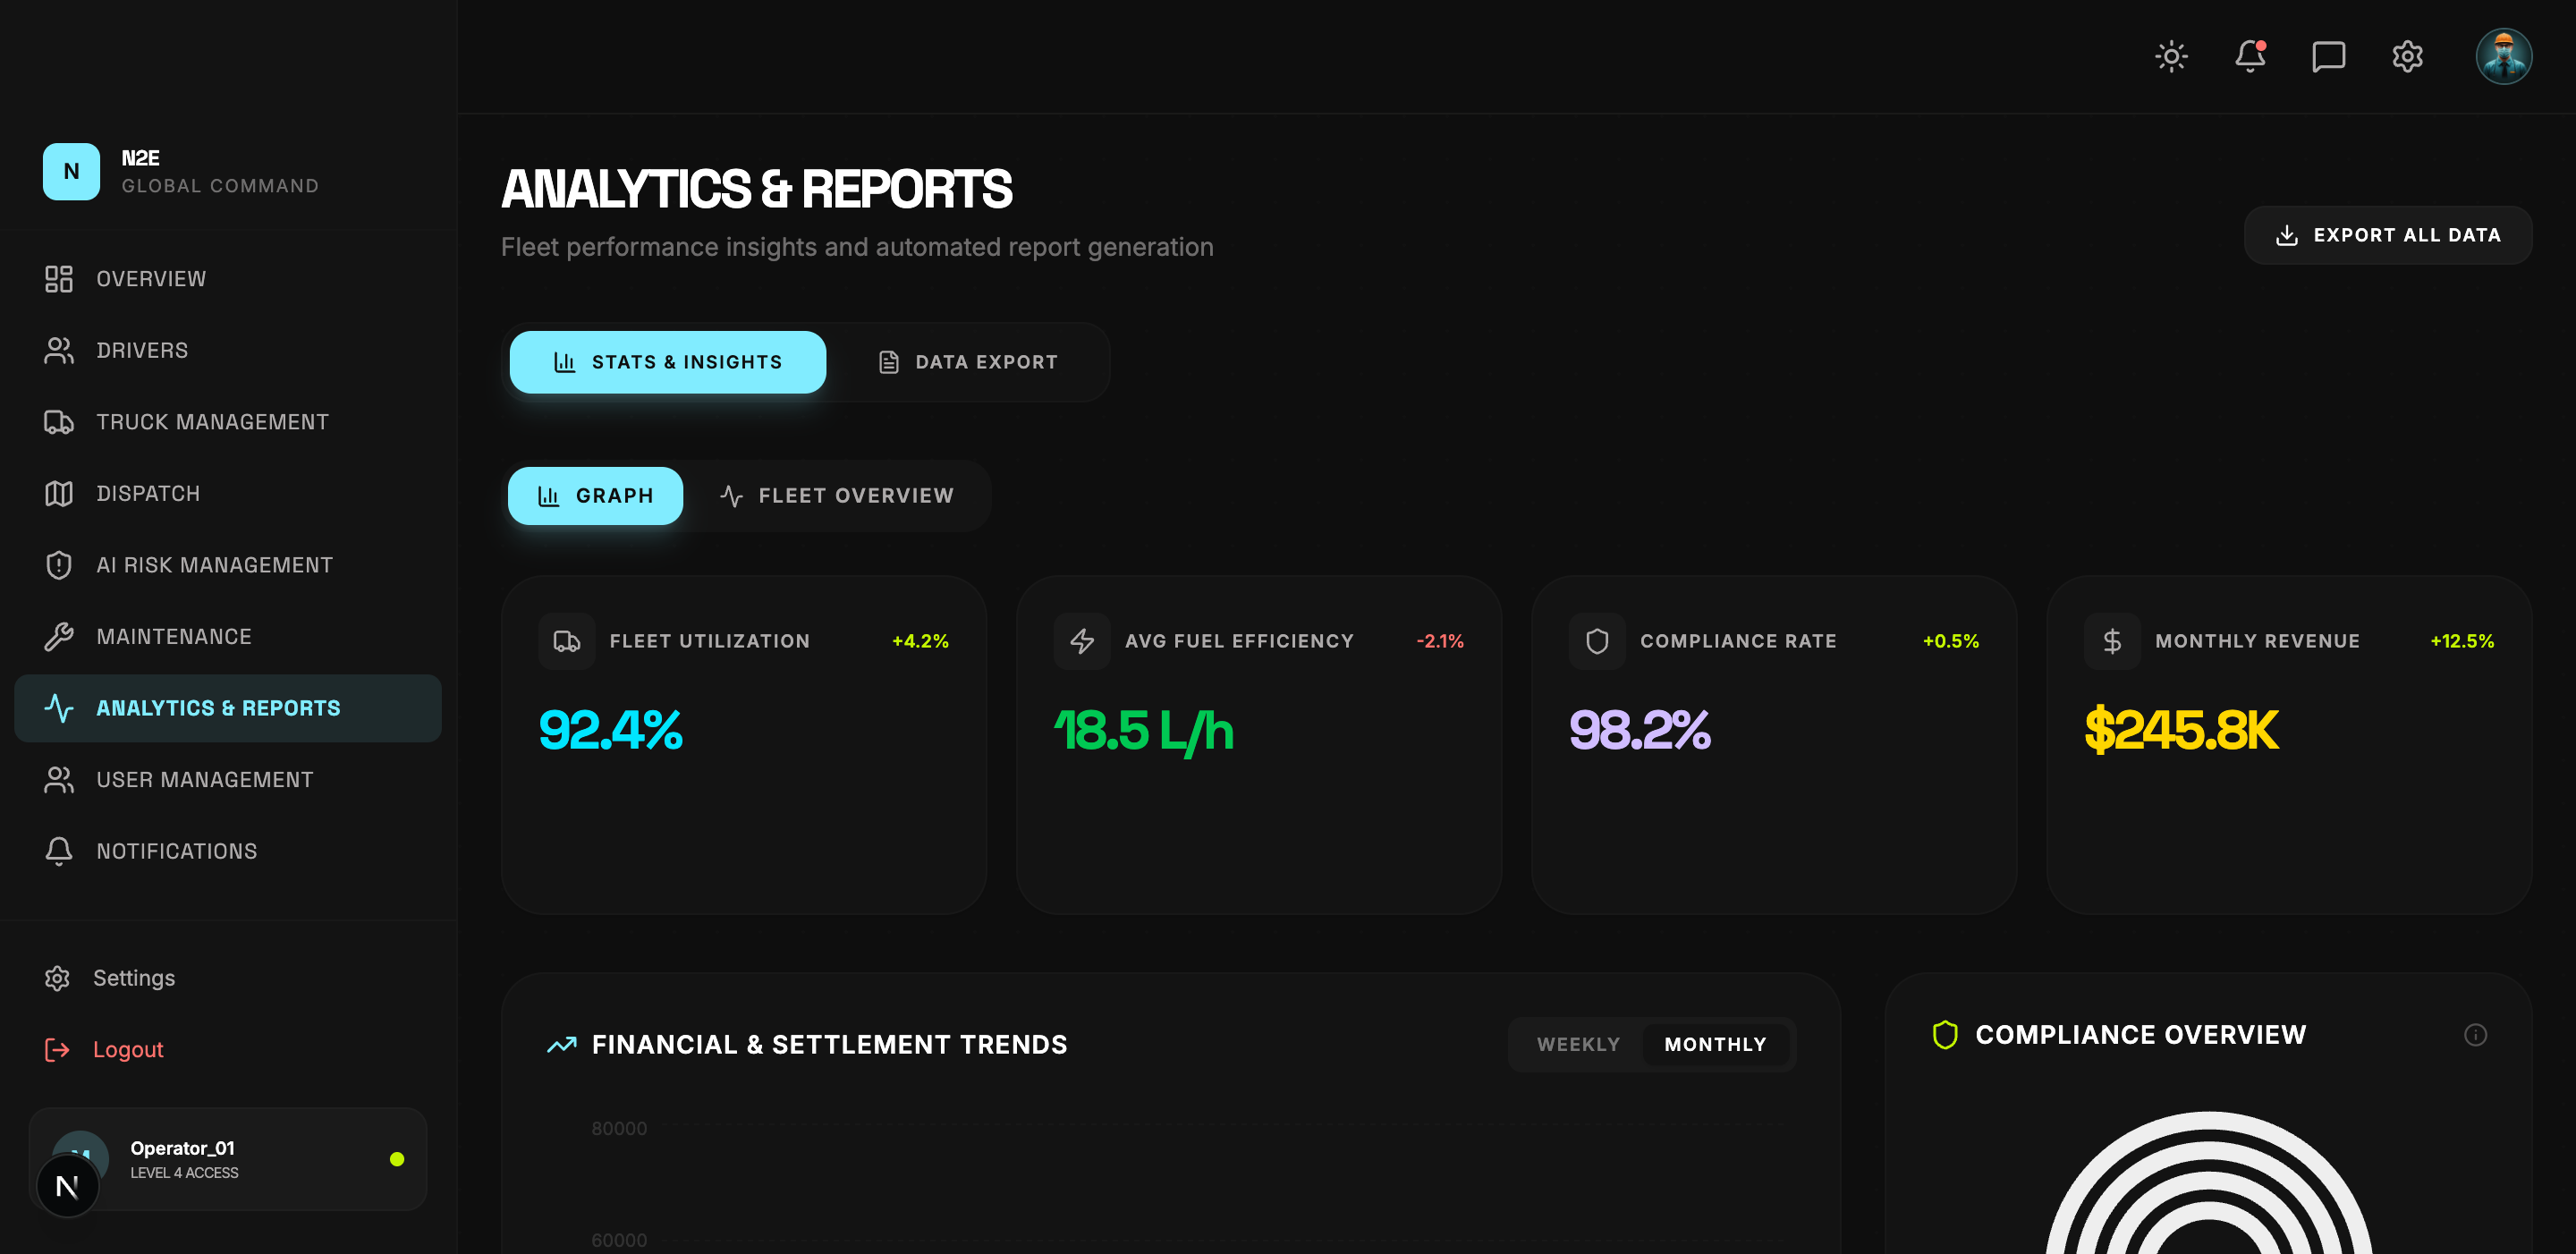
Key KPIs
The top of the Stats & Insights tab shows four KPI cards with sparkline trends:
| KPI | Description |
|---|---|
| FLEET UTILIZATION | Percentage of fleet actively dispatched. |
| AVG FUEL EFFICIENCY | Litres / hour average across the fleet. |
| COMPLIANCE RATE | Compliance score across regulations. |
| MONTHLY REVENUE | Running revenue total. |
Each card displays the current value and the change vs. the previous period (green = up, red = down).
Charts
Below the KPI cards you'll find:
- Financial & settlement trends — weekly / monthly toggle, line chart.
- Compliance overview — combined audit pass + safety score.
- Fleet utilization (7d) — bar chart by day.
- Report distribution — donut chart by report type.
Generating a report
Click into the DATA EXPORT tab to schedule or download:
- Driver performance reports
- Maintenance cost reports
- Compliance & audit reports
- Custom CSV / XLSX exports
The EXPORT ALL DATA button at the top of the page bundles every dataset for the current period into a single archive.
Graph view
The GRAPH tab is an interactive chart explorer for ad-hoc visualisations. Pick a metric, a time range and a comparison series to draw on demand.